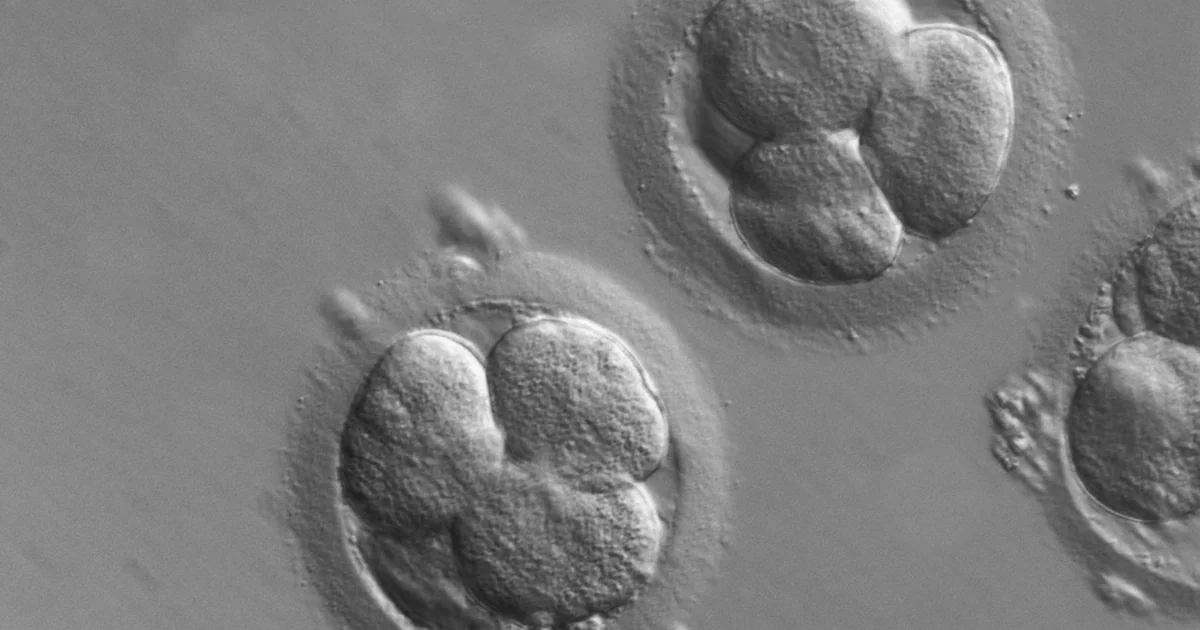
A 5AA blastocyst is the best-looking embryo an embryologist can see under a microscope — and it can still fail, because even a PGT-A-confirmed chromosomally normal embryo implants no more than 50-60% of the time — Cimadomo et al., Human Reproduction Update, 2023. Roughly 4 in 10 transfers of a genetically normal embryo do not produce a live birth, a pattern that repeats across centers and countries.
“The embryo looked perfect” is not the end of the story, and it is usually not your fault. Decades of research have mapped where the loss happens: mostly inside the embryo itself, sometimes in the lining that receives it, and occasionally in male-side or laboratory factors that rarely get checked. This guide walks through the four evidence-based explanations, the tests that genuinely change outcomes, and the ones that do not.
How this guide was made: the ProIVF Medical Editorial Team compiled it from peer-reviewed systematic reviews and meta-analyses indexed in PubMed, plus national registry data from the CDC and SART. Sources are cited and linked in the text. This article is health education, not a personal medical opinion — your own clinic’s record is the only complete picture of your cycle, and every clinical claim was reviewed by our medical advisory board.
What “Good Embryo” Actually Means
Embryologists grade blastocysts with the Gardner system: a number for expansion (1-6) and two letters for the inner cell mass and the trophectoderm, the cells that become the placenta. A 4AA or 5AA is the top score.
Every part of that score is morphological — it describes how the embryo looks at a single moment. It says nothing about the 46 chromosomes inside, and nothing about the lining that will host it.
“Many women do not achieve a pregnancy even after ‘good quality’ embryo transfer. One of the presumed causes is that such morphologically normal embryos have an abnormal number of chromosomes.” — Cornelisse et al., Cochrane Database of Systematic Reviews, 2020, PubMed
| What the embryo grade does tell you | What it cannot tell you |
|---|---|
| Expansion stage and cell-layer appearance | Whether the chromosome count is normal |
| Rough likelihood of surviving vitrification | Whether the lining is receptive this cycle |
| Which embryo to prioritize for transfer | Whether sperm DNA is damaged |
| Day-5 versus day-6 developmental speed | Why a previous transfer failed |
The Most Common Reason: Aneuploidy You Cannot See
Aneuploidy means the embryo has the wrong number of chromosomes — an extra or a missing one. Most aneuploid embryos either fail to implant or miscarry early, and they can look flawless under the microscope.
How common is it among top-graded embryos? Two datasets give a realistic picture:
- In 904 blastocysts from oocytes retrieved at age 33-39, euploidy was 64% in good-quality embryos versus 48% in poor-quality ones — but between good and fair embryos there was no significant difference (64% vs 61%, p = 0.56), so grading cannot separate the top tier — McDaniel et al., Archives of Gynecology and Obstetrics, 2021.
- Among women under 35, good-quality blastocysts were euploid 62.90% of the time, versus 32.46% for poor-quality and 46.70% for average-quality — Li et al., Frontiers in Endocrinology, 2022.
Even in the best morphological group, about one in three embryos carries an abnormal chromosome count — the single largest explanation for a “perfect” embryo that fails, and it is invisible on the grading sheet.
Age is critical here, because an egg’s aneuploidy rate rises sharply with maternal age, so the same grade means very different odds at 32 versus 42. Registry data from the CDC’s ART success-rate reports and SART show the same age gradient in live birth rates. Developmental speed matters too: among 701 single euploid blastocyst transfers, day-5 embryos produced a 60.4% live birth rate versus 44.8% for day-6 embryos, a gap that held after adjusting for grade — Irani et al., Fertility and Sterility, 2018. Two embryos can share the same letters and still have different odds.
Even Genetically Normal Embryos Fail About Half the Time
When a euploid embryo — chromosome count confirmed normal — is transferred, implantation still depends on a chain of steps that current medicine cannot fully inspect: hatching, positioning, the molecular dialogue with the lining, the immune environment, and the transfer itself.
The 2023 Human Reproduction Update systematic review that examined embryonic, maternal, paternal, clinical and laboratory factors named this gap “the black box of implantation.” Its conclusion: the positive predictive value of a normal PGT-A result — how often a genetically normal embryo really implants — is not higher than 50-60% — Cimadomo et al.. A failed transfer of a normal embryo is therefore a statistically expected event, not proof of a defect.
Cumulative data reinforce that framing. A cumulative live birth rate counts the share of patients who deliver at least one baby across a series of transfers, which is different from a single-transfer success rate. In a cohort of 11,463 women and 31,478 untested embryos, that rate kept rising with each transfer — reaching 68.3% after six blastocyst transfers and 78.0% after ten — Dhaenens et al., Human Reproduction, 2025. The same paper cites evidence that most implantation failures after euploid transfer are embryological rather than endometrial, with one series reaching roughly 98% cumulative live birth after five euploid transfers.
One failed transfer, or even two, often reflects the odds rather than a hidden disease. That is why guidelines warn against diagnosing “recurrent implantation failure” too early: the 2022 Lugano consensus called the condition largely over-diagnosed, describing some cases as “a statistical mirage” rather than a functional disorder — Pirtea et al., Fertility and Sterility, 2023. The ESHRE good practice recommendations require genuinely repeated good-quality transfer failures before that workup begins. Our repeated implantation failure guide covers that pathway in detail.
When the Lining, Not the Embryo, Is the Limiting Factor
If the embryo is euploid and still fails, attention shifts to the endometrium — the lining that has to receive it.
Endometrial Thickness: Real, but Is There a Universal Cut-off?
In the largest analysis to date, 30,676 single euploid frozen transfers across 25 centers in three countries, the thinnest linings did show a decline in live birth rate — but the threshold at which the decline appeared varied by center and cycle type — Genovese et al., Human Reproduction, 2025.
A “7 mm rule” is a reasonable clinical heuristic, not a line that dooms a cycle. If your lining measured 6.5 mm, that alone does not explain your failure.
Chronic Endometritis: Found in About a Third of Infertility Patients
Chronic endometritis — a persistent, usually symptom-free inflammation of the lining — tests positive by CD138 immunohistochemistry in 32.7% (87/266) of patients undergoing hysteroscopic assessment for infertility, and positivity was unrelated to how many transfers had previously failed — Hue et al., Clinical and Experimental Reproductive Medicine, 2024.
Because it is common and silent, it is found by testing, not by guessing. Antibiotic treatment when positive is the standard next step.
Hydrosalpinx: Can One Fluid-Filled Tube Sabotage a Good Embryo?
A damaged, fluid-filled fallopian tube can leak fluid into the uterine cavity and interfere with implantation. Treating hydrosalpinx before IVF — usually by removing the affected tube — is supported by a 2025 systematic review and network meta-analysis — Pérez-Milán et al., Ultrasound in Obstetrics & Gynecology.
Our guide to IVF after tubal surgery explains how this decision is framed.
Adenomyosis and Endometriosis
Both conditions alter endometrial receptivity and are associated with lower implantation rates, which is why imaging and, in selected cases, hysteroscopy enter the workup — endometrial receptivity in adenomyosis and endometriosis, Fertility and Sterility, 2023. See our endometriosis and IVF guide.
Thyroid Antibodies and “Immune Protocols”: Usually Not the Answer
In a meta-analysis of 14 studies, thyroid autoimmunity made no significant difference to clinical pregnancy rate in euthyroid women — those with normal thyroid function — with a pooled odds ratio of 0.86 (95% CI 0.70-1.05) — Venables et al., Reproductive Biology and Endocrinology, 2020.
For readers unfamiliar with the statistics: an odds ratio of 1 means no difference between groups, and a 95% confidence interval that crosses 1 means the difference is not statistically significant. Intralipid infusions, empiric steroids and similar “add-ons” are widely marketed after a failed cycle; for an unselected patient the evidence does not support them. The question worth asking is: which specific finding in my case justifies this intervention?
Male and Lab Factors That Rarely Get Checked
Sperm DNA Fragmentation
Sperm contributes half the embryo’s DNA, and its integrity is not measured by a standard semen analysis. Pooled data from 13 studies found male partners of women with recurrent pregnancy loss had a significantly higher sperm DNA fragmentation rate than fertile controls — a mean difference of 11.91 (95% CI 4.97-18.86) — McQueen et al., Fertility and Sterility, 2019.
If good embryos keep failing or pregnancies keep ending early, this is a reasonable test to raise with your clinic.
The Transfer Technique Itself
How the embryo is placed matters. A comprehensive 2022 systematic review and meta-analysis of randomized trials evaluated interventions around the time of transfer — catheter choice, ultrasound guidance and related techniques — against clinical pregnancy rates — Tyler et al., Human Reproduction Update, 2022.
The practical points supported by this literature: transfer under ultrasound guidance, a soft catheter, and no prolonged bed rest afterwards. The old advice to lie flat for hours adds nothing but anxiety.
The Laboratory
Embryo culture is a technical craft — incubator stability, culture media, air quality, and the timing of biopsy and vitrification — and lab quality is one of the few things you can genuinely compare between clinics before committing. Our guide to the IVF lab lists the key performance indicators to request.
Which Tests and Treatments Actually Change the Odds?
| Test or intervention | What the evidence says | Who may benefit |
|---|---|---|
| PGT-A on remaining embryos | Reduces miscarriage risk; in already-diagnosed RIF it did not significantly improve live birth rate per transfer — Newnham et al., 2026 | Decisions at higher maternal age, or when choosing among several embryos |
| ERA (endometrial receptivity array) | Did not improve outcomes in euploid transfer cycles, with or without prior failed transfers — Mei et al., 2023 | Not routinely indicated |
| Chronic endometritis testing + antibiotics | CD138-positive in ~1 in 3 infertility patients; treatment when positive is standard | After failed transfers, or with an unexplained picture |
| Hydrosalpinx surgery before IVF | Supported by systematic review and network meta-analysis | Confirmed hydrosalpinx |
| Ultrasound-guided transfer | Supported by randomized-trial evidence | Everyone |
| Thyroid antibody / empiric immune protocols | No significant benefit in euthyroid women | Not routinely |
| Bed rest after transfer | No benefit | Nobody — get up and live your life |
The interventions that work are all targeted at a specific, diagnosed problem. The ones marketed to everyone after a failure do not survive meta-analysis.
Patient Stories: Three Embryos That Looked Perfect
The following accounts are anonymized composites drawn from common clinical scenarios and patient conversations, with names and identifying details changed. They illustrate how the evidence above plays out — they are not individual medical cases.
Claire, 34, California — “The grade on paper was perfect.” Claire transferred a single 4AA day-5 blastocyst from her first cycle — textbook, as her clinic put it — and her pregnancy blood test came back negative. She spent about $17,000 on that cycle including medication, and when the clinic later tested the rest of that batch, only 2 of 5 embryos were chromosomally normal.
“I kept thinking I did something wrong in the two-week wait,” she says. “Nobody told me that a perfect-looking embryo can be carrying the wrong number of chromosomes. That single sentence would have saved me a month of guilt.”
Nadia, 39, Bangkok — “The third transfer worked after they treated something else.” After two failed transfers with PGT-A-normal embryos, Nadia’s clinic looked at her lining instead, and a biopsy returned CD138-positive chronic endometritis. She completed a course of antibiotics, waited one cycle, and transferred her third euploid embryo — this time it implanted, with total spend across three cycles close to $32,000 including travel from Singapore.
“I was ready to accept that my eggs were simply too old,” she recalls. “It turned out there was something treatable sitting there the whole time.”
Daniel and Sofia, 37, Madrid — “The problem was on my side.” Two transfers with good-quality embryos failed for Daniel and Sofia, and all the testing had been done on Sofia. A sperm DNA fragmentation test showed a raised fragmentation index; the couple switched to ICSI (intracytoplasmic sperm injection), and Daniel completed three months of targeted antioxidant therapy and lifestyle changes before the next cycle. Their daughter was born the following year.
“We had spent two years thinking of it as her problem,” Daniel says. “Hearing that half the embryo’s DNA came from me — and that it was measurable — changed everything about how we approached the third cycle.”
FAQ
Q: How likely is a grade-A embryo to be chromosomally normal?
In oocytes retrieved at age 33-39, good-quality blastocysts were euploid 64% of the time, versus 61% for fair and 48% for poor-quality embryos — so roughly one in three top-grade embryos is still abnormal — McDaniel et al., 2021. Below age 35 the figure is about 63% — Li et al., 2022 — and it falls with maternal age, which is why the same grade carries different odds at 32 and 42.
Q: Can a genetically normal euploid embryo still fail to implant?
Yes — and it is common: the positive predictive value of a normal PGT-A result is no higher than 50-60%, meaning about 4 in 10 euploid transfers do not end in a live birth — Cimadomo et al., 2023.
This is the “black box of implantation”: chromosomes are only part of the story.
Q: Should I do PGT-A after one failed transfer with a good embryo?
Not automatically: PGT-A lowers miscarriage risk and helps choose among embryos, but in patients already diagnosed with recurrent implantation failure it did not significantly improve live birth rate per transfer — Newnham et al., 2026.
The decision comes down to maternal age, how many embryos you have, and how much you want to avoid a miscarriage — our embryo testing guide compares the options.
Q: How thin is too thin for the endometrium?
There is no universal cut-off: in 30,676 single euploid frozen transfers the thinnest linings showed a decline in live birth rate, but the threshold varied by center and cycle type — Genovese et al., 2025.
A lining of 6-7 mm is worth discussing, not automatically a reason to cancel, and 8 mm or more is generally considered reassuring.
Q: How many failed transfers before I should ask for a workup?
Guidelines anchor the recurrent implantation failure workup at roughly three good-quality transfers, or two to three euploid transfers — ESHRE, 2023. Before that point failure is often statistical: in a cohort of 11,463 women, cumulative live birth rate kept climbing to 68.3% after six transfers and 78.0% after ten — Dhaenens et al., 2025.
Q: Is ERA testing worth the money?
For euploid transfers, the published evidence says no: a systematic review of ERA-guided euploid embryo transfer found it did not improve reproductive outcomes, whether or not the patient had previous failed transfers — Mei et al., 2023.
It is not a routine test.
Q: Can my partner’s sperm cause a good embryo to fail?
It can contribute: male partners of women with recurrent pregnancy loss had a significantly higher sperm DNA fragmentation rate than fertile controls — a mean difference of 11.91 (95% CI 4.97-18.86) — McQueen et al., 2019.
A standard semen analysis does not measure this, so it has to be requested specifically.
Q: What should I do differently in the next cycle?
Start with your own cycle record: ask for the embryo grades and transfer day, whether PGT-A was performed, the endometrial thickness and pattern, and the protocol used; if you have had two or more failed transfers of good embryos, ask whether cavity assessment and chronic endometritis testing are indicated — that inflammation is CD138-positive in about 32.7% of infertility patients yet usually symptom-free — and if there is a history of loss, ask whether sperm DNA fragmentation has been checked.
Then weigh the cumulative success data rather than a single cycle, and consider a second opinion at a clinic that publishes its laboratory metrics.
Planning Your Next Cycle After a Failed Transfer
A failed transfer with a good embryo is a medical question with a mostly reassuring answer: the largest single cause lives inside the embryo, and it is not something you did. The productive next steps are concrete — get your full cycle record, confirm whether the embryos were tested, test the lining and the male side where the history justifies it, and skip the add-ons that meta-analysis has not supported.
If you are considering a second opinion or a change of clinic, ProIVF publishes verified outcome data, doctor profiles and pricing for fertility centers across the US, Thailand, Malaysia, Turkey, Georgia and beyond, so you can compare on evidence rather than advertising. Compare IVF clinics or talk to our team about what your cycle record suggests.
This article is health education and does not replace personalized medical advice. Treatment decisions should be made with your own reproductive endocrinologist, based on your full medical history and your clinic’s records.
How this guide was created: written by the ProIVF Medical Editorial Team and reviewed by the ProIVF Medical Advisory Board. It is based on peer-reviewed systematic reviews and meta-analyses indexed in PubMed, plus national registry data from the CDC and SART. Every statistic is cited to its original source. Learn more about ProIVF.
Last updated: September 10, 2026.